Image ChatGPT Image 2
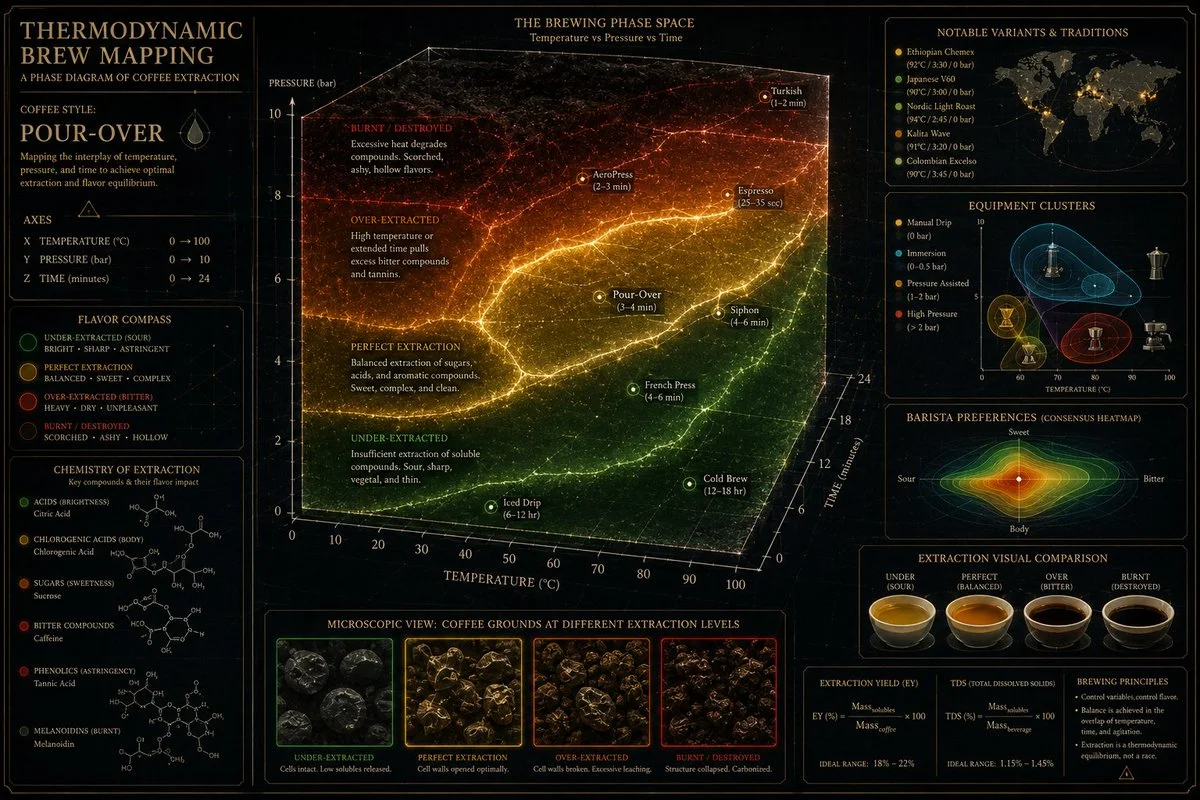
Espresso extraction mapped on a thermodynamic phase diagram
A scientific infographic blends coffee table photography with alchemical aesthetics, showing under-extracted, perfect, and over-extracted zones.
Prompt
coffee_style = [coffee preparation method] // Examples: "Espresso", "Pour-over", "French press", "Cold brew" PHASE_SPACE_PLOT( x_axis = temperature (°C) [0 → 100], y_axis = pressure (bar) [0 → 10], z_axis = time (minutes) [0 → 24], optimal_zone = INFER(target_parameters FROM coffee_style.ideal_extraction) * 1.8, phase_regions = { under_extracted: INFER(sour_zone FROM low_temp OR low_time) * 1.4, perfect_extraction: optimal_zone.boundary_curve * 1.9, over_extracted: INFER(bitter_zone FROM high_temp OR long_time) * 1.4, burnt_region: INFER(destroyed_zone FROM excessive_heat) * 1.3 }, data_points = [ INFER(notable_variants FROM coffee_style.regional_methods), INFER(equipment_clusters FROM coffee_style.machine_types), INFER(barista_preferences FROM coffee_style.expert_consensus) ] * 1.5, visualization_style = ( Scientific_phase_diagram * 0.40 + Coffee_table_book_photography * 0.25 + Modernist_infographic * 0.20 + Alchemical_manuscript_aesthetic * 0.15 ), annotations = "Chemical compounds formed in each zone", color_coding = "Flavor quality gradient from green→gold→brown→black", insets = "Microscopic coffee grounds, extraction comparison photos" ) - (boring_graph / 4) - (random_science_aesthetic / 3) OUTPUT: Coffee brewing as rigorous thermodynamic science.
Published: May 27, 2026 by Gadgetify