Image ChatGPT Image 2
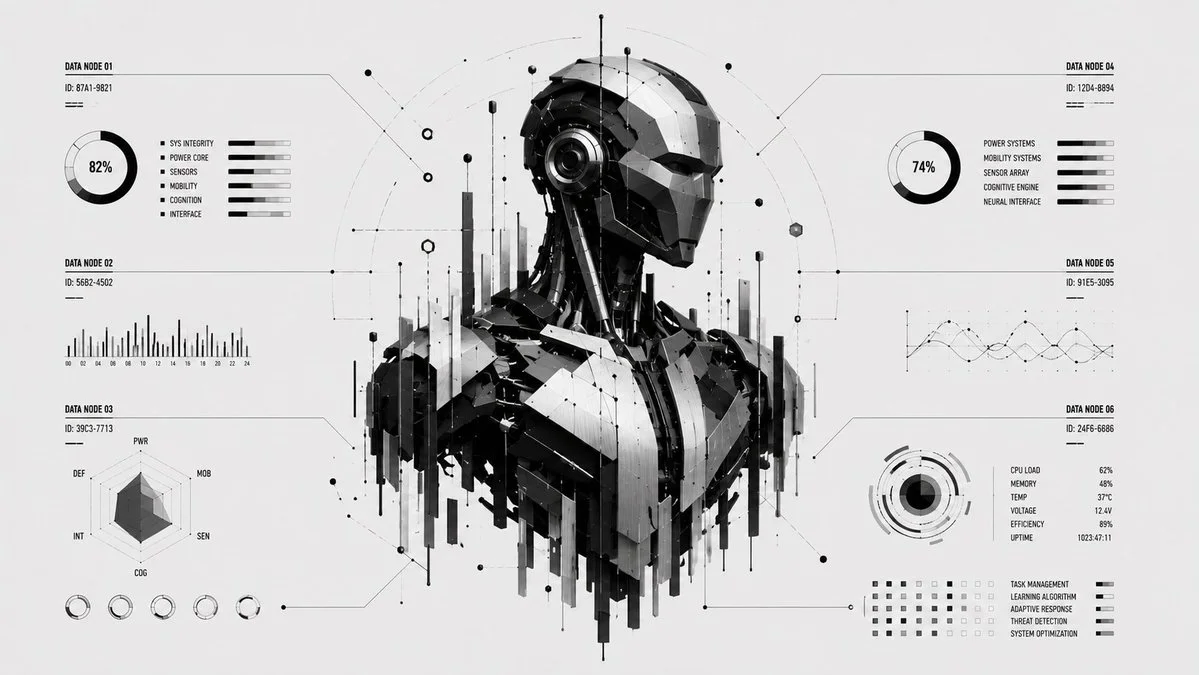
Sleek Geometric Data Visualization in Bold Colors
Explore a sophisticated design featuring floating bars, circles, and polygons. This ultra-clean infographic-style visualization uses a striking color palette of [COLOR1] and [COLOR2].
Prompt
[SUBJECT] interpreted as a sophisticated geometric data visualization, floating bars, circles, and polygons arranged systematically, only [COLOR1] and [COLOR2], ultra-clean infographic-inspired design
Published: June 1, 2026 by Zephyra Leigh