Image ChatGPT Image 2
Unveiling Urban Life: A CT Scan of City Dynamics
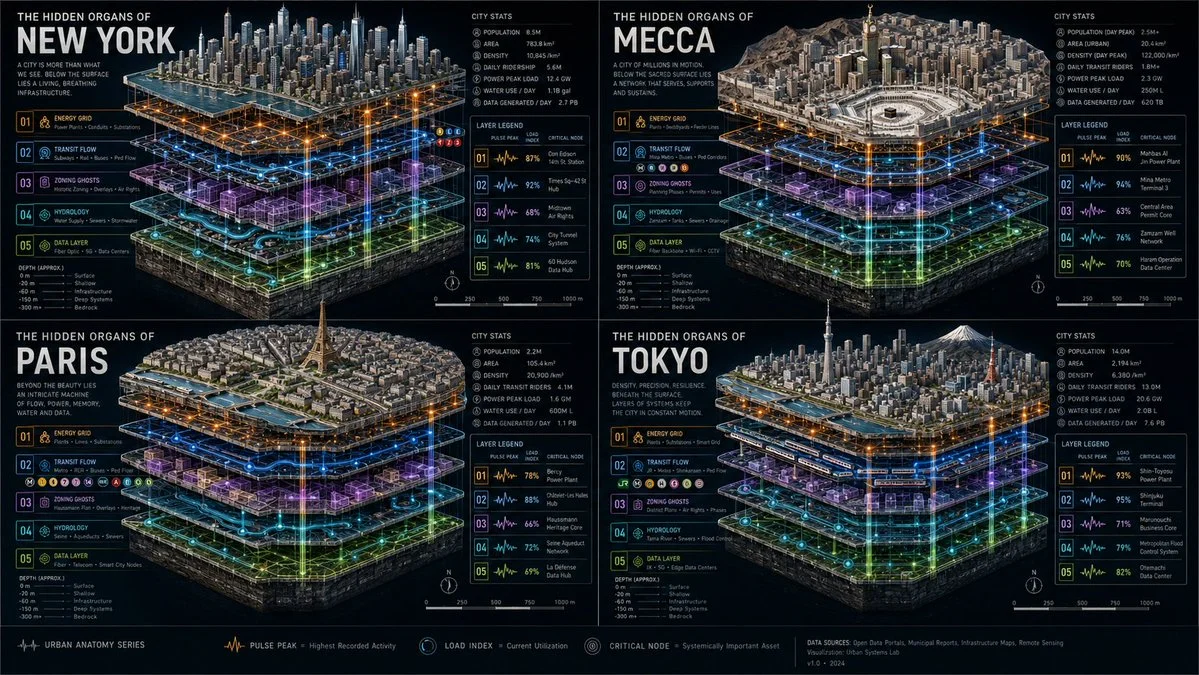
Explore a unique visualization of four iconic cities, revealing their internal structures. This CT scan showcases energy flows, transit patterns, and hydrological systems, offering a fresh perspective on urban life.
Prompt
# In[1]: Import Urban Anatomy Engines
import auto_inference_engine as ai
import editorial_renderer as er

subject = "[$CITY_NAME]"

# In[2]: Multi‑Layer Urban Slicing
df_city_layers = ai.scan_city_strata(subject, layers=['Energy Grid','Transit Flow','Zoning Ghosts','Hydrology','Data Layer'])
df_city_layers['pulse_peak'] = df_city_layers.detect_rhythm_hotspot()

# In[3]: Render Transparent Axonometric View
fig = er.Canvas(style="Architectural Cutaway 3D", lighting="Neon Cartographic", dof="Infinite Focus")
fig.add_title(f"THE HIDDEN ORGANS OF {subject.upper()}")

for index, slice in df_city_layers.iterrows():
    frame = fig.add_frame(shape="Isometric Slab", size=slice.coverage_area)
    frame.render_3d_model(slice.infra_texture, lighting="Heatmap Overlay")
    frame.add_technical_label(f"{slice.urban_layer} | {slice.pulse_peak} | Density: {slice.load_index}")
    fig.draw_elevator_shaft(previous_frame, frame, style="Fiber Optic Thread")

fig.add_scale_bar("Underground depth, historical fill, bedrock")
fig.add_cross_section_legend(df_city_layers[['urban_layer', 'pulse_peak', 'load_index', 'critical_node']])

# In[4]: Render
fig.render(quality="High‑Res Urban Planning Editorial")
Published: May 12, 2026 by Gadgetify