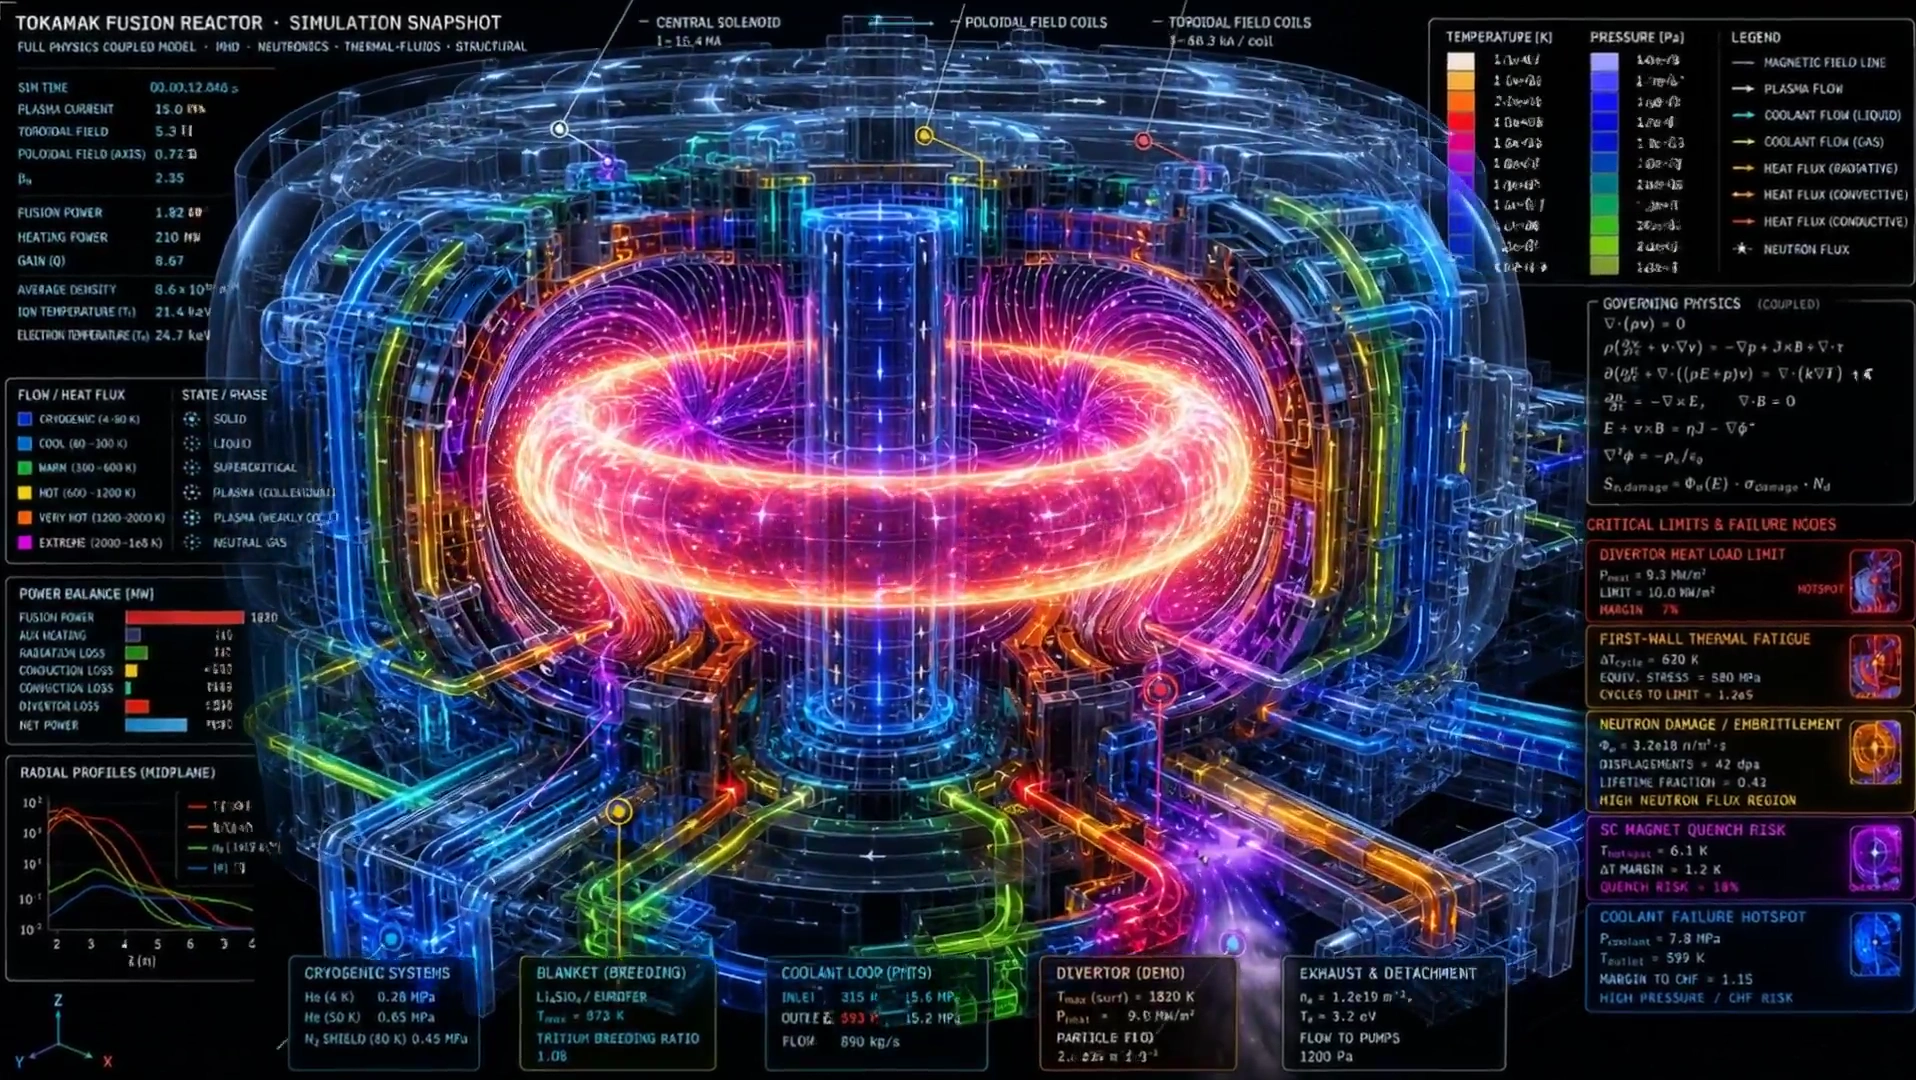
Volumetric Flow Fields Map Heat Transfer Within a Glass Reactor
High-contrast visualization of phase changes, convective heat transfer, and critical failure nodes annotated with physical thresholds.
Prompt
Perform a comprehensive thermodynamic and fluid-state mapping of [$THERMAL_SYSTEM].
Autonomously derive the internal physics, focusing on phase transitions, heat transfer mechanisms, and fluid dynamics.
1. Render the system's physical housing as highly transparent, frosted glass. Inside, visualize the working fluids not as solid objects, but as dynamic volumetric flow fields.
2. Dynamically map the thermodynamic cycle: color-code the fluid paths based on real-time temperature and pressure gradients. Explicitly visualize phase changes (e.g., liquid to supercritical fluid to plasma) using distinct particle densities and emission shaders.
3. Overlay vector fields showing convective heat transfer, conductive thermal bridging through the containment walls, and radiative heat flux.
4. Identify and highlight "critical failure nodes"—areas where cavitation, thermal shock, or neutron embrittlement are most likely to occur, annotating them with their specific physical thresholds (e.g., "Yield strength drops at 850°C").
Visual execution: A dark, high-contrast environment where the system's internal energy provides the primary illumination. Use HUD-style data overlays (graphs, equations, isotherm contour lines) floating in 3D space around the model. The aesthetic should feel like a multi-million-dollar supercomputer simulation frozen in time.
Published: May 31, 2026 by Gadgetify